Privia Security was chosen as one of Türkiye's fastest growing companies!

Privia Security was chosen as one of Türkiye's fastest growing companies!
Wireshark is a network packet and protocol analysis (sniffer) tool. Formerly known as Ethereal, it enables the capture of all incoming and outgoing data traffic on a computer network. It allows you to inspect traffic flowing over a network as well as observe the contents of incoming or outgoing traffic. It also includes many features for traffic inspection. As a result, Wireshark is today known as one of the most widely used and most productive network analysis tools of its kind.
In this article, we will use Wireshark to analyse a small amount of network traffic. Wireshark installation is simple and quick. During installation, it creates a virtual network card on your computer and enables all traffic to be tunnelled through that network card. This allows it to record all traffic passing through the virtual network card it creates.
First, we run the Wireshark shortcut from the Start menu in administrator mode. This grants authorisation via Windows UAC to inspect all traffic. Otherwise, it will not be able to analyse traffic and will return an error.
When Wireshark is first launched, it performs an update check and if a new version is detected, it will warn you and ask you to update. After passing this step, the Wireshark application opens as shown below.
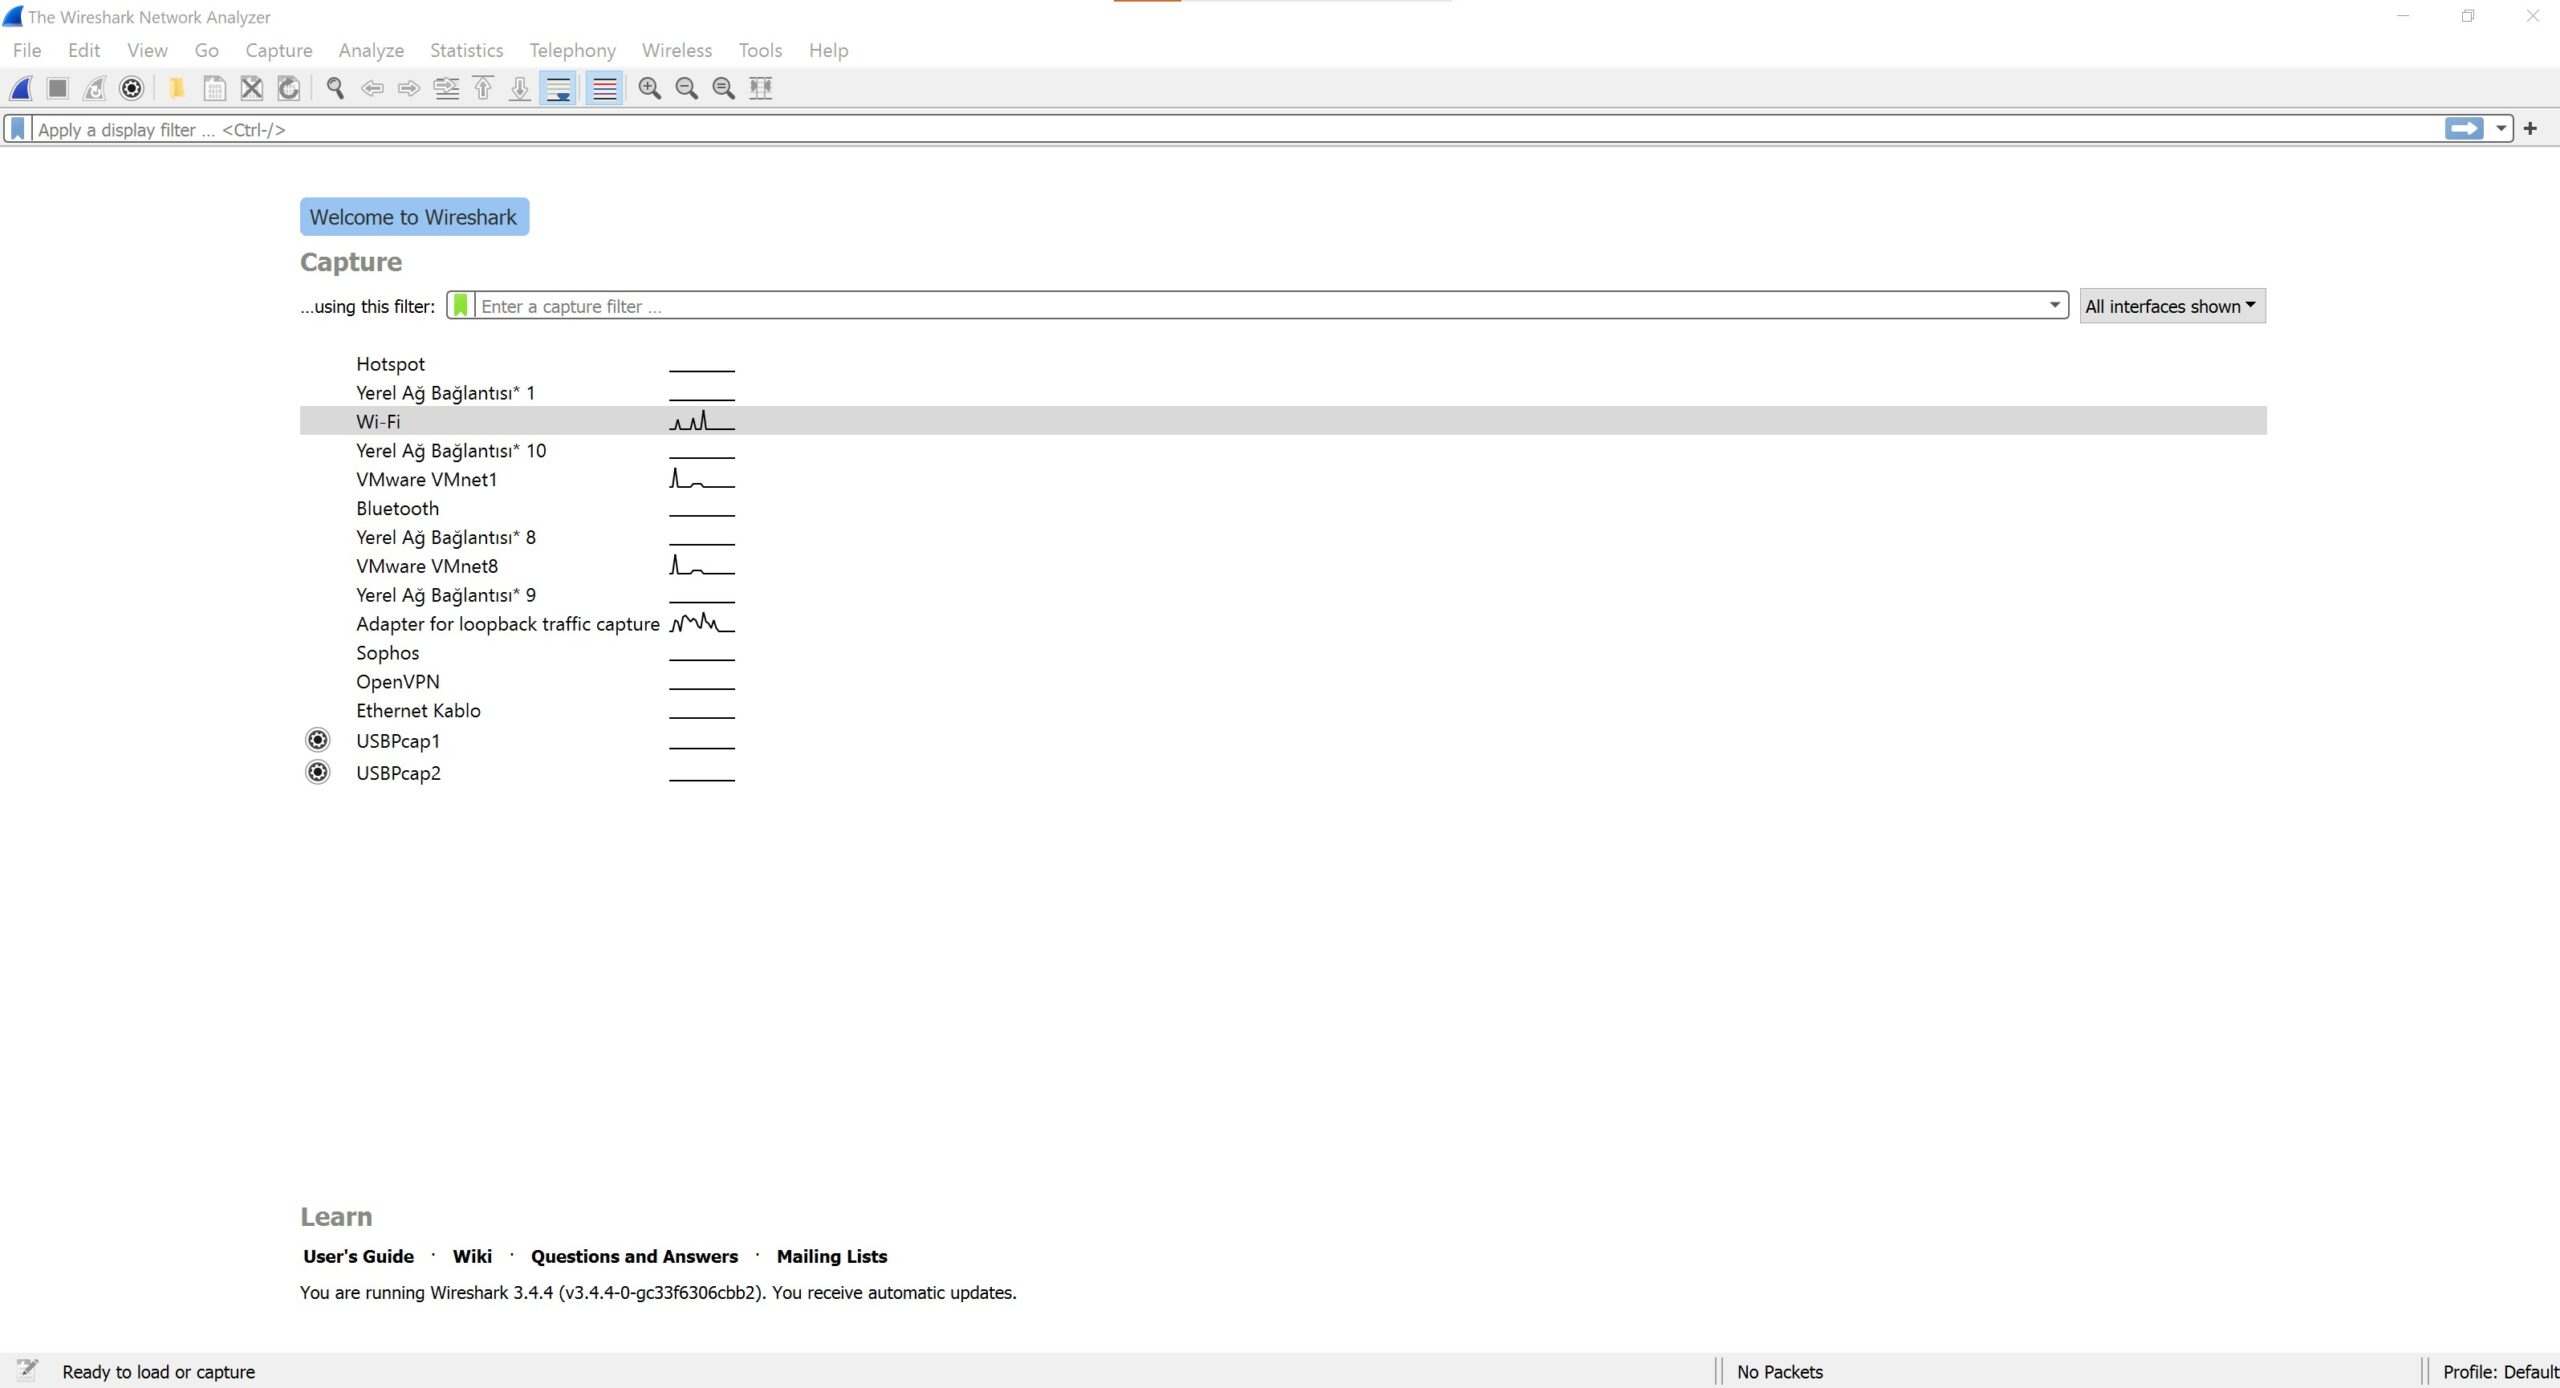
When you select your network card whose traffic you want to inspect within this interface, Wireshark will begin showing you packets. We can filter between incoming and outgoing packets by typing the type of traffic we want to filter into the filter menu at the top.
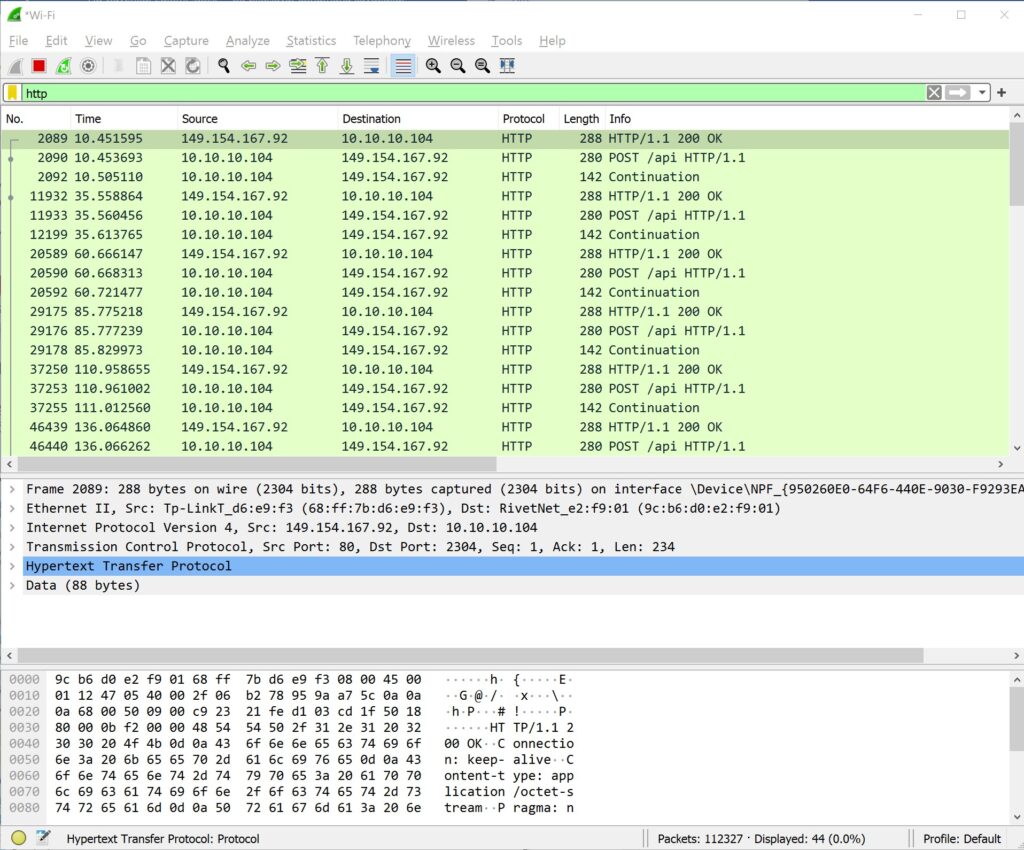
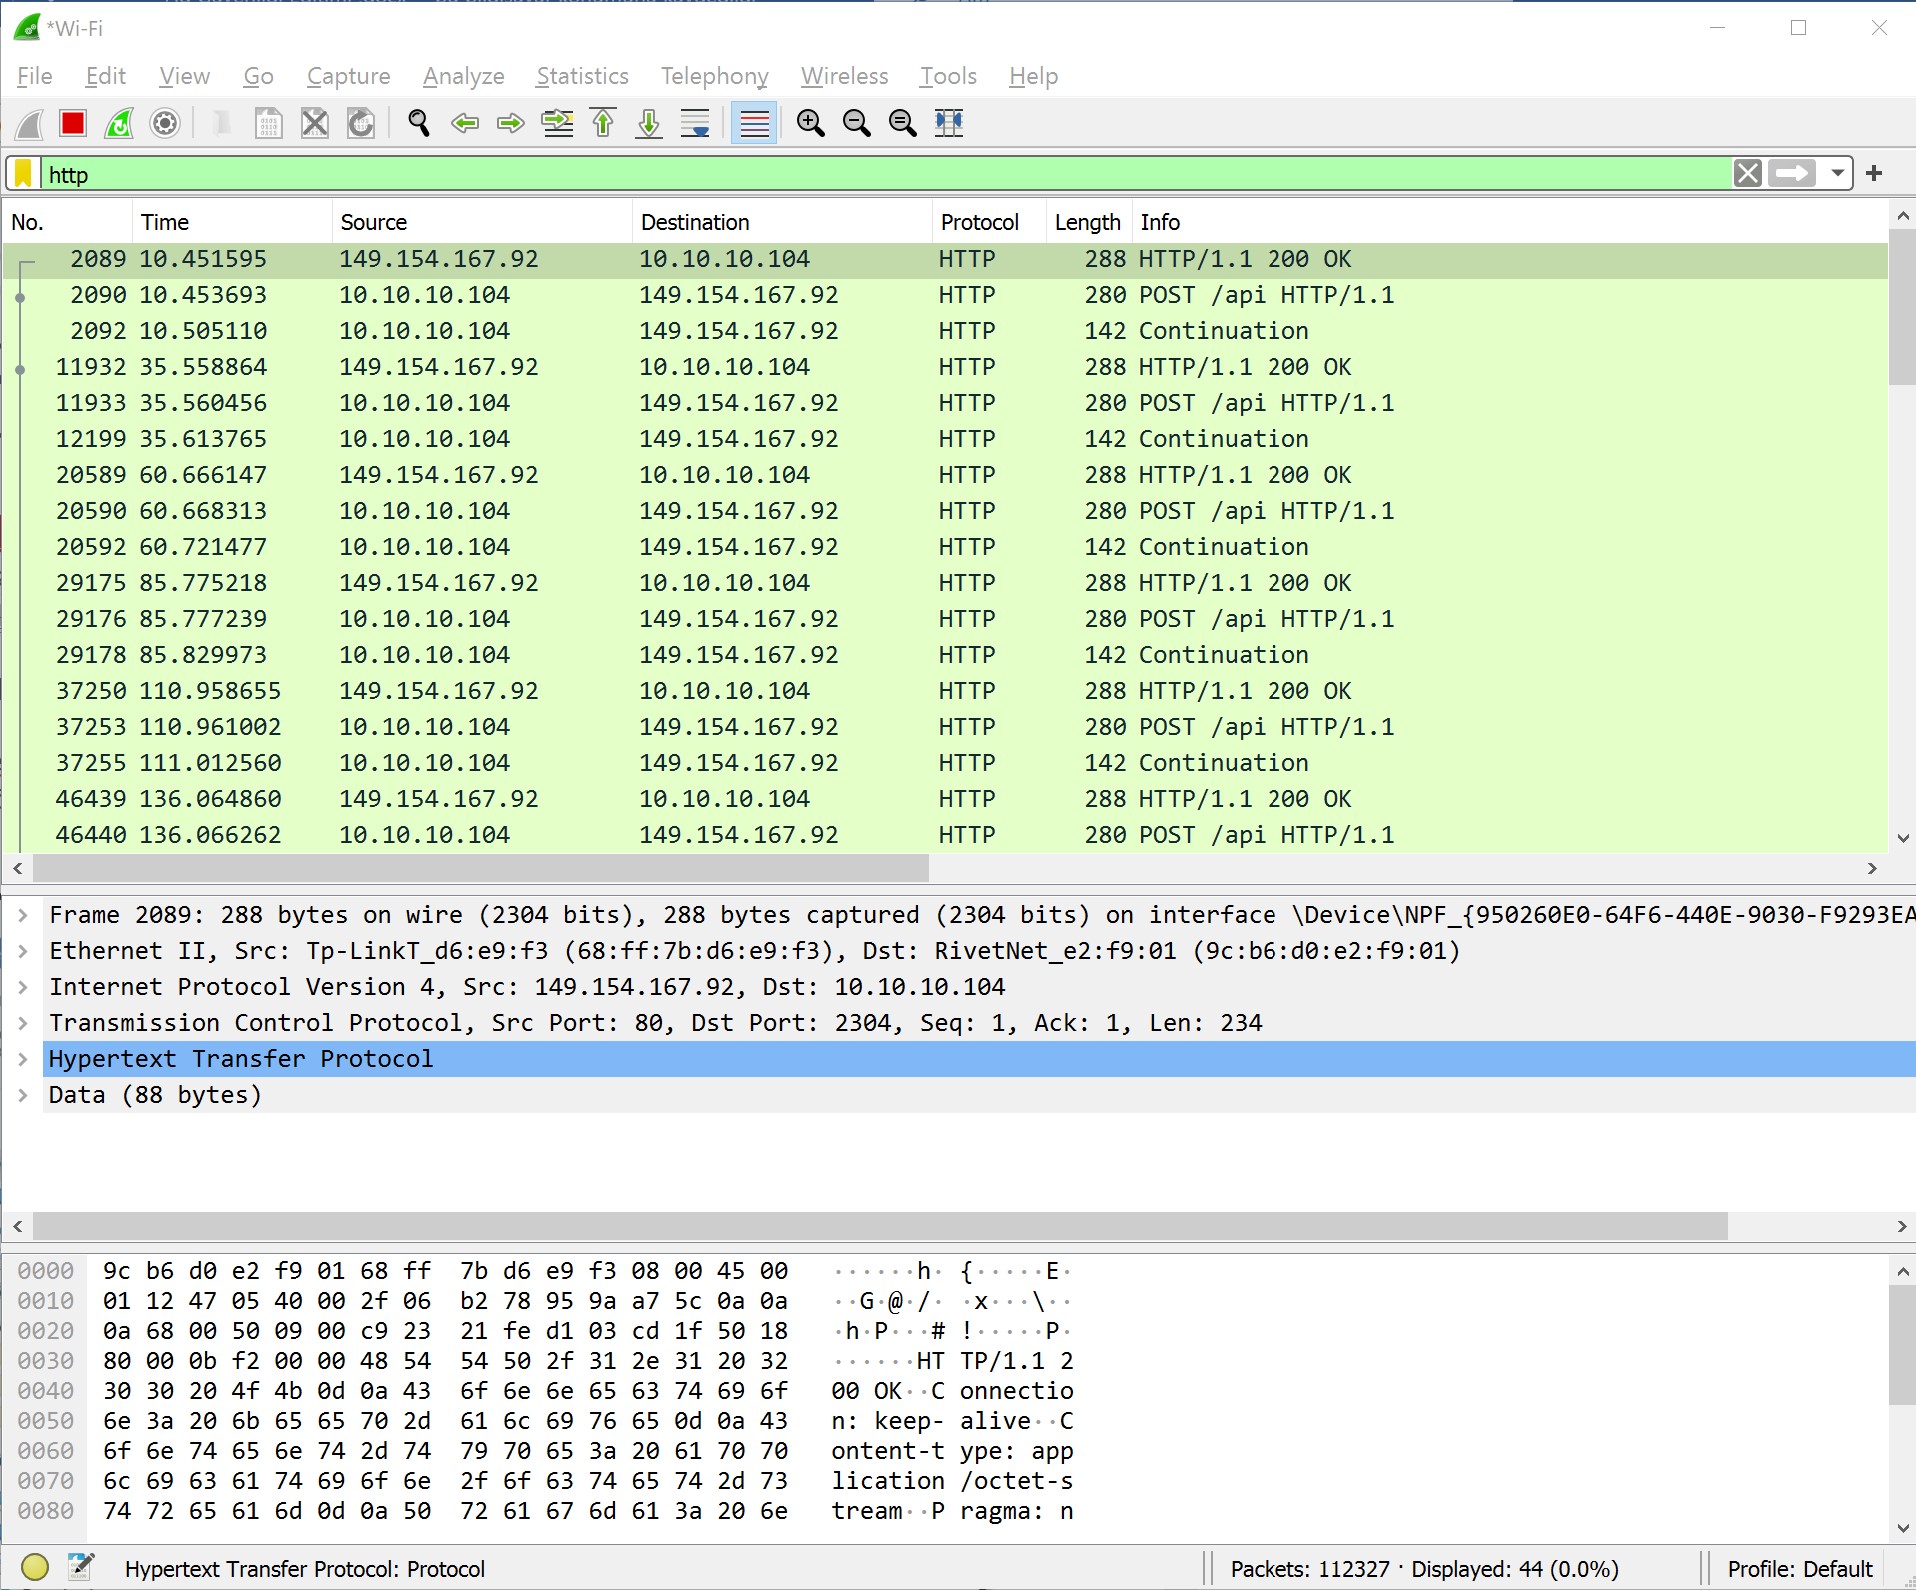
When we type “http” into the filter box, only HTTP traffic will begin flowing on the interface as shown above. Looking at the columns, the No column shows the packet number, Time shows the time, Source shows the packet’s origin, Destination shows the destination, Protocol shows the protocol type, Length shows the length, and Info shows brief information about the packet. In this filtering we can inspect HTTP traffic, and we can also filter by http2 or http3.
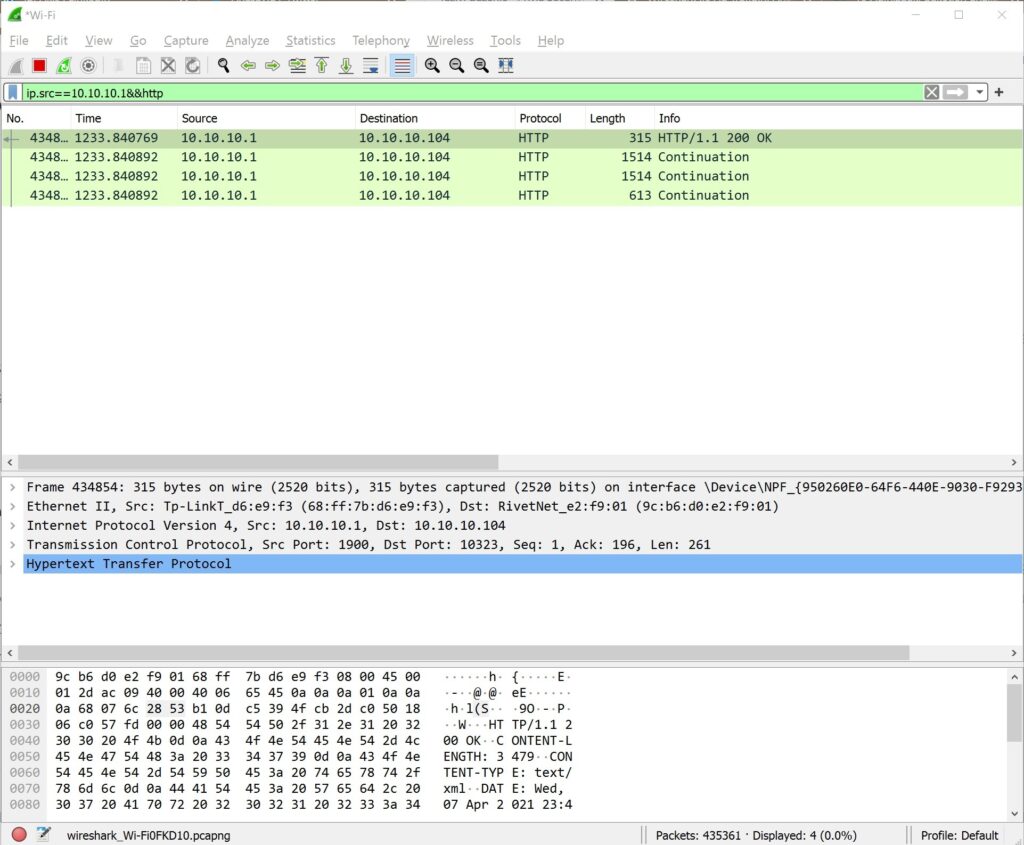
You can filter traffic within the network according to the source IP address. We can perform the filtering by writing a specific IP address into the filter section in the format ip.src==10.10.10.1.
In this example, we use the ip.src== command to filter traffic coming from 10.10.10.1, which is our modem’s address. This allows us to see all traffic for the source IP address 10.10.10.1. To see only HTTP traffic within all traffic, we can use the command ip.src==10.10.10.1&&http. This also allows us to monitor the modem’s traffic.
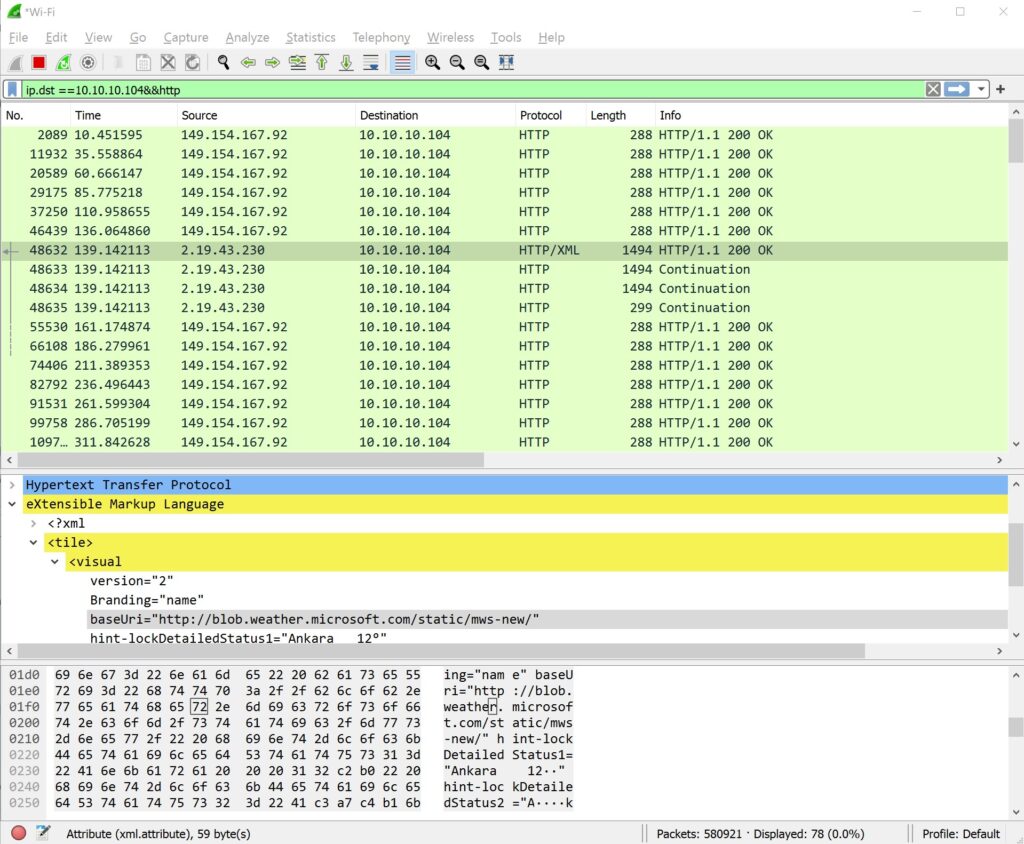
As you can see above, we filter using ip.dst==10.10.10.104&&http. This filters traffic going to an IP address. At the same time, with &&http we see only the HTTP packets among those going to this IP address. While we used ip.src earlier, this time we use ip.dst to specify the destination. As can be seen in the image above, the IP address 10.10.10.104 is visible in the Destination column.
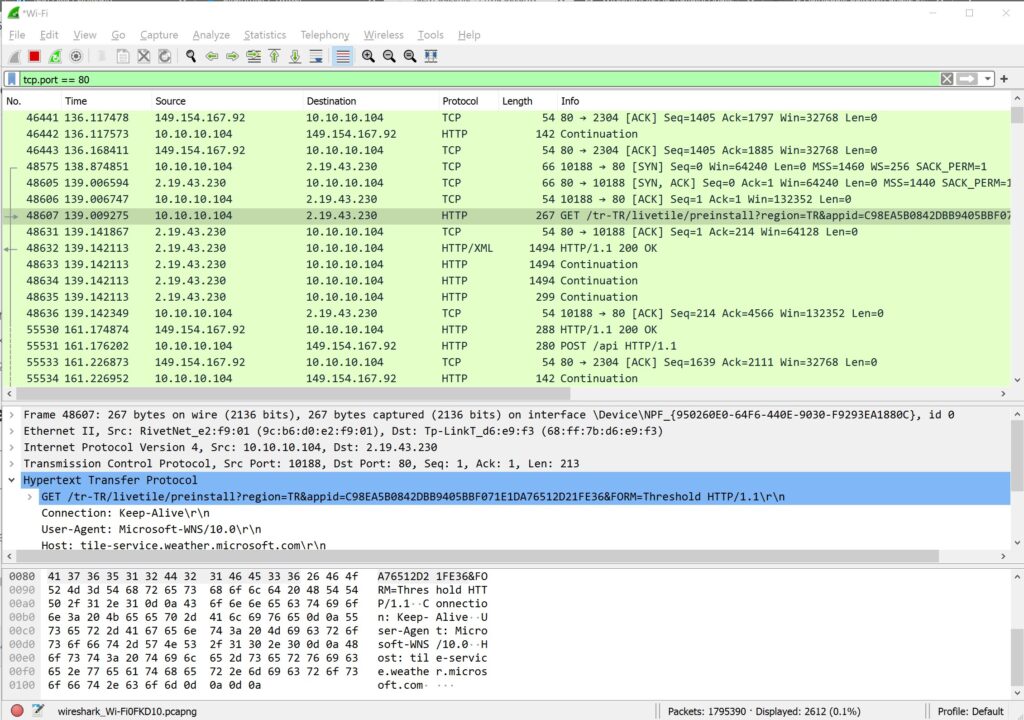
We can also filter and inspect traffic going to a web server using Wireshark. With the command tcp.port == 80, we filter TCP port 80, the web port. As can be seen in the graph above, we filter all traffic going to and from port 80. We can also view multiple ports in this filtering instead of just a single port. With the command tcp.port == 80 || tcp.port == 443, we list both ports 80 and 443.
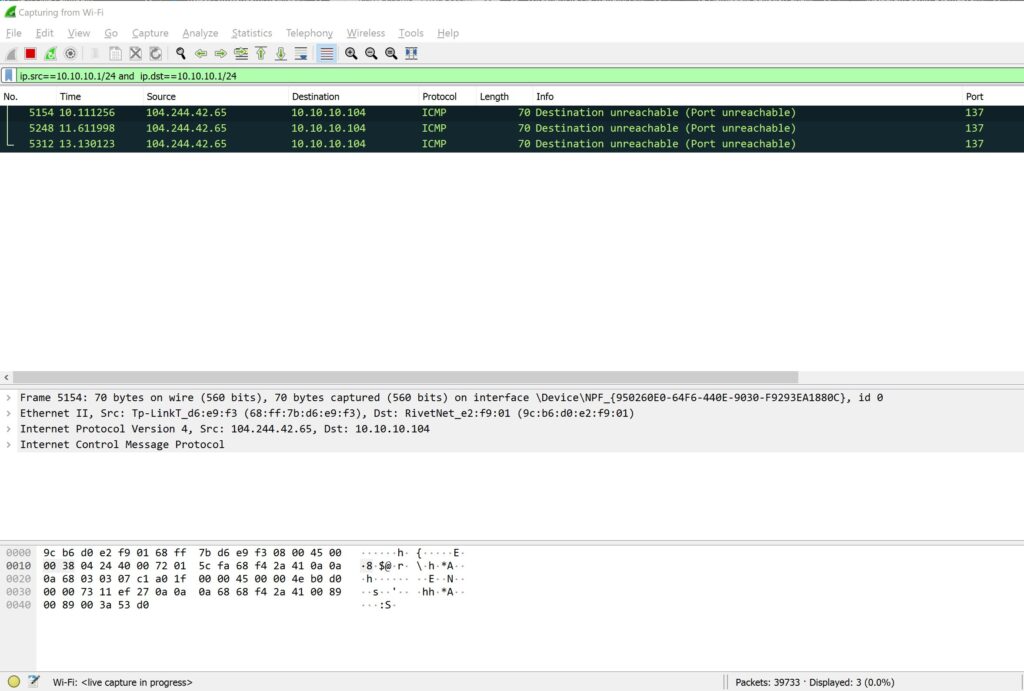
With this filtering logic, you can inspect only local network traffic. This way, traffic coming from or going to the internet will be ignored. We can only view and inspect traffic occurring on our local network. For this filtering, we can use the command ip.src==10.10.10.1/24 and ip.dst==10.10.10.1/24. In the first command, we cover our local network as the IP source using /24. Then using “and” we specify the destination network. Again in the destination network we use /24 to cover the entire IP block.
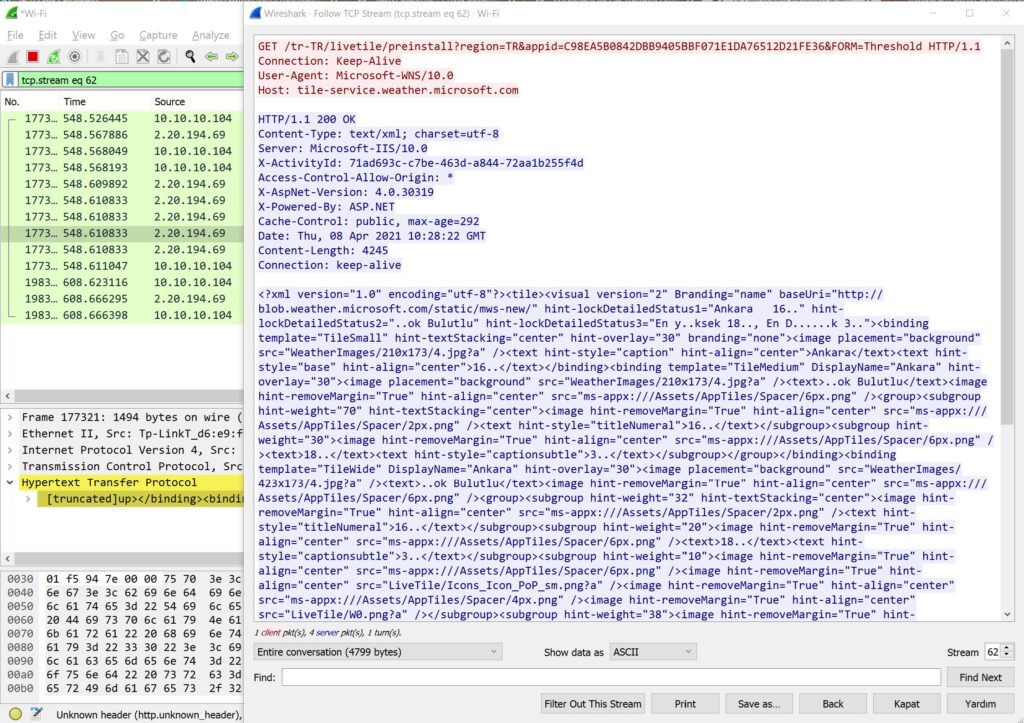
To inspect the contents of a TCP communication, simply right-click on a packet in Wireshark and select the Follow TCP Stream menu. The contents of the message thread will open in a new window. If we are inspecting web traffic, you can see the HTTP headers and any plain-text credentials transmitted during the transaction, if any exist.
You can save network traffic with Wireshark by using Save As to record it to a file in PCAPNG or many other formats and share it. You can also open a recorded traffic file via the File menu and perform analysis. Wireshark supports many packet traffic recording formats. Thanks to this feature, it is a practical and preferred piece of software.
Wireshark is a frequently used tool in penetration tests. It is also one of the most popular tools used to detect anomalies on a network and check packet contents.
Wireshark can run on Linux, macOS, BSD, Solaris, and some other Unix-like operating systems, and there is also a version for Microsoft Windows. You can also use the terminal-based (non-GUI) version called TShark. Wireshark is a free tool released under the terms of the GNU General Public License.
You May Be Interested In These